Back
Building an ERC721 Mint Dashboard Using Hemera and UDFs
December 2, 2024|

Blockchain data is a treasure of information, but let’s face it—extracting meaningful data has always been a challenge. Traditional methods often involve clunky queries, scalability nightmares, and high costs. Enter Hemera Protocol and its User-Defined Functions (UDFs). These magical Python-based scripts allow you to slice and dice blockchain data effortlessly. No more wrestling with complex APIs or endless loops—just concise, reusable logic that gets the job done.
In this tutorial, we’ll build an ERC721 Mint Dashboard, where our mission is simple:
-
Extract all mint events for a given ERC721 contract address.
-
Showcase this data on a sleek frontend.
Let’s roll up our sleeves and get started. By the end of this tutorial, you’ll have a functional dashboard that makes querying ERC721 mints as easy as pie.
What’s So Special About UDFs?
Before we jump into the code, let’s understand why UDFs are a game-changer:
-
Efficiency: UDFs query only what you need. Want to extract just ERC721 mints? Done.
-
Reusability: Write your logic once, use it across multiple projects.
-
Scalability: Handle massive amounts of blockchain data without breaking a sweat.
-
Customization: Whether it’s DeFi, NFTs, or GameFi, UDFs adapt to your needs.
Imagine trying to extract every ERC721 mint manually—oh, the horror! With UDFs, you can streamline the process into a few simple steps.
Overview of What We’re Building
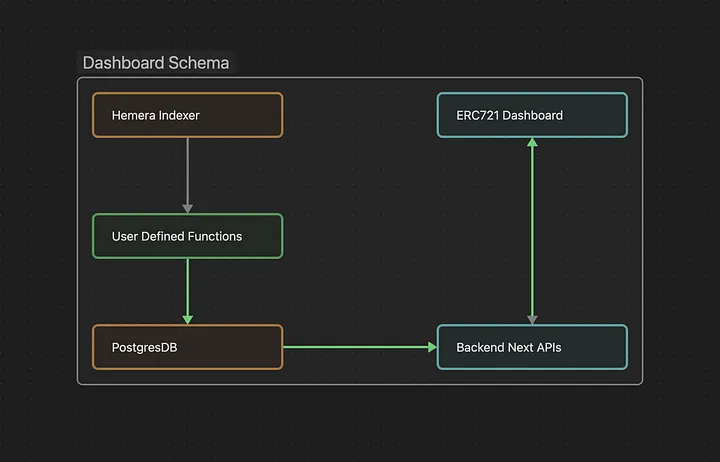
The Backend:
-
Define a UDF to fetch mint events.
-
Store the data in a Postgres database.
The Frontend:
-
Display the mint data in a user-friendly dashboard.
-
Include features like search, filters, and charts for mint statistics.

Let’s start with the heart of it all—the UDF.
Building the UDF for ERC721 Mints
A UDF in Hemera is like a custom data extraction tool, purpose-built for specific blockchain queries. It integrates directly with the Hemera Indexer to fetch, process, and store data in a structured way.
Let’s break down each step to understand how we’re building a UDF for ERC721 mint events.
-
Data Class: Defines the structure of the extracted data.
-
Models: Maps the data to the Postgres database.
-
UDF Logic: Contains the actual logic to process the blockchain data.
Here’s how we create a UDF to fetch ERC721 mint events.
Step 1: Define the Data Class
The Data Class is the blueprint for the data we want to extract. It defines the fields and their data types. Think of it as setting up the shape of the puzzle pieces before solving the puzzle.
-
Purpose: Acts as a schema for the data output.
-
Fields:
-
token_id: The ID of the ERC721 token being minted. -
minter: The address of the wallet minting the token. -
timestamp: The block timestamp when the mint occurred.
-
from hemera.udf import DataClass

class ERC721MintData(DataClass):
    token_id: str
    minter: str
    timestamp: str
Step 2: Create the Model
The Model maps the extracted data to a database table in Postgres. This is how the indexer knows where to store the data after processing. It uses SQLAlchemy for defining the database schema.
-
Purpose: Stores data in a structured format for easy querying.
-
Fields:
-
token_id: Stored as a string in the database. -
minter: Stored as a string representing the wallet address. -
timestamp: Stored as a DateTime field for chronological sorting.
-
from hemera.db import Model

class ERC721MintModel(Model):
    __tablename__ = 'erc721_mints'
    token_id = Model.Column(Model.String)
    minter = Model.Column(Model.String)
    timestamp = Model.Column(Model.DateTime)
Step 3: Write the UDF Logic
The UDF Logic is where the heavy lifting happens. It listens to blockchain events, processes the data, and sends it to the data model.
-
Purpose: Defines the actual data extraction process.
-
Flow:
-
Listens for mint events on the blockchain (e.g., an ERC721
Transferevent wherefrom = 0x0). -
Extracts
token_id,minter, andtimestampfrom the event. -
Passes the processed data to the model for storage.
-
from hemera.udf import UDF, Trigger

class ERC721MintUDF(UDF):
    def execute(self, event):
        token_id = event.params['tokenId']
        minter = event.params['to']
        timestamp = event.block_time

self.output(ERC721MintModel(token_id=token_id, minter=minter, timestamp=timestamp))Running the UDF with the Indexer
Once you've built your UDF, the next step is to run it alongside the Hemera Indexer. The indexer processes blockchain events and triggers your UDF logic when specific conditions are met (e.g., a mint event). Here’s a detailed guide on how to properly run your UDF.
Step 1: Configure Your UDF
Before running your UDF, you’ll need to ensure that it’s correctly configured in the Hemera environment.
-
Update the Indexer Configuration: Modify the
indexer-config.yamlfile to include the contract address. Example: https://github.com/HemeraProtocol/hemera-indexer/blob/feature/add-demo-job/config/indexer-config-template.yaml
Step 2: Start the Hemera Indexer
You’ll need to launch the Hemera Indexer with your UDF integrated. The indexer will listen to blockchain events and execute your UDF when a relevant event occurs.
Option 1: Dockerized Setup
If you prefer containerization, run the following command:
sudo docker compose upRead more on Docker Setup: https://docs.thehemera.com/hemera-indexer/installation/install-and-run#id-2.-run-docker-compose
Option 2: Command Line Execution
For direct execution on your system:
python hemera.py stream \
    --provider-uri https://eth.llamarpc.com \
    --debug-provider-uri https://eth.llamarpc.com \
    --postgres-url postgresql+psycopg2://devuser:devpassword@localhost:5432/hemera_indexer \
    --output jsonfile://output/eth_blocks_20000001_20010000/json,csvfile://output/hemera_indexer/csv,postgresql+psycopg2://devuser:devpassword@localhost:5432/eth_blocks_20000001_20010000 \
    --start-block 20000001 \
    --end-block 20010000 \
    --output-types block,transaction,log \
    --block-batch-size 200 \
    --batch-size 50 \
    --max-workers 8
Read more about the command line attributes: https://docs.thehemera.com/hemera-indexer/configurations
Monitor Logs: Use the logs to confirm that your UDF is triggered and processing events correctly.
Once the indexer is running, the mint data will be stored in the Postgres database. Victory!
Step 3: Verify Data Output
After the indexer processes events, the extracted data will be stored in your Postgres database or exported to other formats like JSON. Here’s how you can verify the output:
Query the Postgres Database: Use a SQL client or CLI tool to inspect the
erc721_mints table.SELECT * FROM erc721_mints ORDER BY timestamp DESC;
Building the Frontend Dashboard
Now that our UDF is extracting data and storing it in the Postgres database, it's time to bring the data to life with a frontend dashboard built using Next.js. This dashboard will provide an intuitive interface for users to view, search, and visualize the token mint data.
In this section, we'll break down the key components of the dashboard, explain what they do, and link to their implementation in the codebase.
Frontend Architecture
The dashboard is divided into the following key components:
-
Header: Displays the dashboard title and relevant details like the contract address.
-
API Route: Fetches data from the Postgres database.
-
Transfer Table: Displays the mint data in a structured tabular format.
-
Transfer Chart: Visualizes mint trends over time.
-
Dashboard Wrapper: Combines all components and manages the overall state.
Building the Frontend Dashboard with Next.js
Now that our UDF is extracting data and storing it in the Postgres database, it's time to bring the data to life with a frontend dashboard built using Next.js. This dashboard will provide an intuitive interface for users to view, search, and visualize the token mint data.
In this section, we'll break down the key components of the dashboard, explain what they do, and link to their implementation in the codebase.
Frontend Architecture
The dashboard is divided into the following key components:
-
Header: Displays the dashboard title and relevant details like the contract address.
-
API Route: Fetches data from the Postgres database.
-
Transfer Table: Displays the mint data in a structured tabular format.
-
Transfer Chart: Visualizes mint trends over time.
-
Dashboard Wrapper: Combines all components and manages the overall state.
You can find the complete code on the GitHub repository
1. Header Component
The
Header.tsx component is responsible for rendering the dashboard title and contextual information. It uses Next.js Image for rendering the logo and styled-components for styling.Key Features
-
Displays the Hemera logo.
-
Shows the wallet address of the smart contract being tracked.
Code Snippet
const Header: React.FC<HeaderProps> = ({ walletAddress }) => (
    <HeaderWrapper>
        <Logo>
            <Image src="/hemera-logo.jpg" alt="Hemera Logo" width={100} height={100} />
        </Logo>
        <Title>Token Transfer Tracker</Title>
        <Description>Contract: {walletAddress}</Description>
    </HeaderWrapper>
);
Check the full implementation in
Header.tsx2. API Route
The API route in Next.js fetches data from the Postgres database. The
/api/transfers endpoint retrieves token mint data and converts any binary fields (like addresses) into a readable hex format.Key Features
-
Fetches the 100 most recent ERC721 mints.
-
Converts address fields into human-readable hex strings.
-
Handles errors gracefully.
Code Snippet
const result = await pool.query('SELECT * FROM erc721_token_mint ORDER BY block_timestamp DESC LIMIT 100');

const formattedData = result.rows.map(row => ({
    ...row,
    address: Buffer.from(row.address.slice(2), 'hex').toString('hex'),
    token_address: Buffer.from(row.token_address.slice(2), 'hex').toString('hex'),
}));

res.status(200).json(formattedData);
View the complete code in
/pages/api/transfer.ts3. Transfer Table
The
TransferTable.tsx component displays the fetched data in a tabular format. It provides a clean, sortable view of mint details, such as the wallet address, token ID, block number, and transaction hash.Key Features
-
Address Formatting: Shortens long wallet addresses for readability.
-
Timestamp Formatting: Converts blockchain timestamps to a human-readable format.
-
Hover Effects: Highlights rows for better usability.
Code Snippet
const formatAddress = (address: string | null) =>
            address ? `${address.slice(0, 6)}...${address.slice(-4)}` : 'N/A';

const TransferTable: React.FC<Props> = ({ transfers }) => (
    <Table>
        <thead>
            <tr>
                <Th>Address</Th>
                <Th>Token Address</Th>
                <Th>Token ID</Th>
                <Th>Block</Th>
                <Th>Timestamp</Th>
                <Th>Transaction</Th>
                <Th>Log Index</Th>
            </tr>
        </thead>
        <tbody>
            {transfers.map(transfer => (
                <Row key={`${transfer.transaction_hash}-${transfer.log_index}`}>
                    <Td>{formatAddress(transfer.address)}</Td>
                    <Td>{formatAddress(transfer.token_address)}</Td>
                    <Td>{transfer.token_id}</Td>
                    <Td>{transfer.block_number}</Td>
                    <Td>{new Date(transfer.block_timestamp).toLocaleString()}</Td>
                    <Td>{formatAddress(transfer.transaction_hash)}</Td>
                    <Td>{transfer.log_index}</Td>
                </Row>
            ))}
        </tbody>
    </Table>
);
The complete implementation can be found in
TransferTable.tsx4. Transfer Chart
The
TransferChart.tsx component visualizes trends in mint activity, such as the number of high-value mints over time. It uses Chart.js for rendering a responsive line chart.Key Features
-
Plots token transfer amounts against timestamps.
-
Includes smooth line curves and data points for better visualization.
Code Snippet
const TransferChart: React.FC<Props> = ({ transfers }) => {
    const data = {
        labels: transfers.map(transfer => transfer.timestamp),
        datasets: [
            {
                label: 'High-Value Transfers',
                data: transfers.map(transfer => transfer.amount),
                borderColor: '#3a3f51',
                backgroundColor: '#f4a261',
                pointRadius: 3,
                tension: 0.2,
            },
        ],
    };

    return (
        <ChartWrapper>
            <Line data={data} options={{ responsive: true, maintainAspectRatio: false }} />
        </ChartWrapper>
    );
};
Explore the full code in
TransferChart.tsx5. Dashboard Wrapper
The
Dashboard.tsx component ties everything together. It fetches data from the API, manages loading and error states, and passes the data to child components like TransferTable and TransferChart.Key Features
-
Fetches data using
fetchTransfersfrom the/api/transfersendpoint. -
Handles loading and error states gracefully.
-
Integrates all sub-components seamlessly.
Code Snippet
useEffect(() => {
    const fetchData = async () => {
        try {
            const data = await fetchTransfers();
            setTransfers(data);
        } catch (err) {
            setError('Failed to fetch transfers');
        } finally {
            setLoading(false);
        }
    };
    fetchData();
}, []);
Find the full implementation in
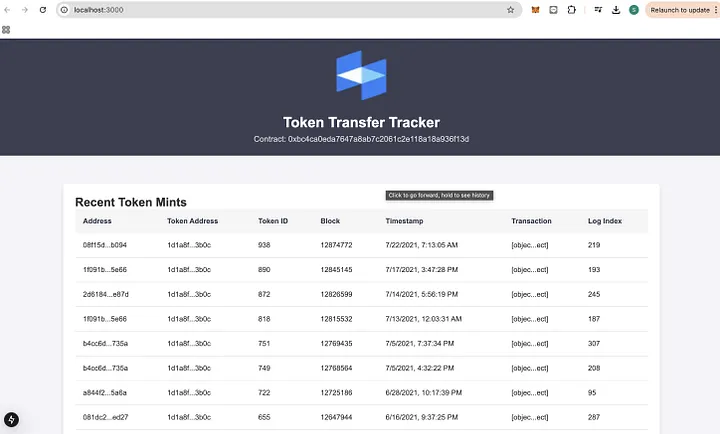
Dashboard.tsx This is what the dashboard would look like:

Next Steps: Enhancing Your Dashboard
With your ERC721 Mint Dashboard up and running, you now have a functional application to track and visualize token mint events. But why stop here? The Hemera Protocol and its UDFs open up a world of possibilities for scaling, optimizing, and adding new features to your application.
Here’s what you can do next:
Feature Enhancements
Add Advanced Filters
-
Allow users to filter by date ranges, specific wallets, or token IDs for more granular analysis.
-
Example: Show mints only for a specific wallet over the past week.
Aggregate Data for Insights
-
Add aggregated metrics like:
-
Top Wallets by Mints
-
Most Active Days for Minting
-
Scaling Beyond the Dashboard
The Hemera Protocol isn’t just about ERC721 mints—it’s a versatile tool for blockchain data computation and extraction. Here are other use cases you can explore using UDFs:
-
DeFi Protocol Tracking: Build dashboards to track lending or staking activities across protocols.
-
Portfolio Analytics: Fetch wallet balances and transaction histories for comprehensive user portfolios.
-
GameFi Stats: Monitor token mints, transfers, and burn events for gaming platforms.
With every new UDF you create, you’re building reusable logic that can power multiple applications.
Joining the Hemera UDF Builder Program
If building this dashboard sparked your curiosity, the Hemera UDF Builder Program is the perfect way to dive deeper. This program is designed for developers to explore Hemera’s capabilities, create impactful UDFs, and earn rewards for their contributions.
Why Join?
-
Exclusive RewardsEarn tier-based stipends and one-time bounties for UDF contributions.
-
Industry RecognitionGet featured in Hemera’s newsletter, blog, and social media.
-
Network OpportunitiesConnect with industry leaders, partners, and investors.
-
Learn and GrowWork on real-world use cases, get feedback, and access one-on-one mentorship.
Get Started Today
To join the UDF Builder Program and unlock exclusive perks:
-
Visit the UDF Builder Program Page
-
Clone the https://github.com/thecoderpanda/token-transfer-tracker/ repository to start building right away.
Simplifying Blockchain Data One UDF at a Time
The Hemera Protocol and its User-Defined Functions (UDFs) are redefining how we interact with blockchain data. From streamlined data queries to scalable applications like the ERC721 Mint Dashboard, Hemera empowers developers to build powerful, real-world tools with ease.
The journey doesn’t stop here. With Hemera, the possibilities are endless. Whether it’s creating new dashboards, optimizing existing logic, or contributing to the growing ecosystem, you’re at the forefront of blockchain data innovation.